This group view works much like column grouping in Excel and can be thought of as a column outline.
Here is the example of the completed table:
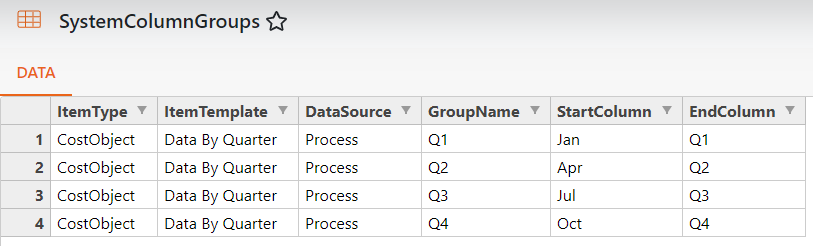
The resulting view has a “+/-“ sign available next to the GroupName as indicated in the table. Clicking on the “+/-“ sign will expand and collapse the grouping:
The Q1 column group is expanded, the Q2, Q3, and Q4 groups are collapsed
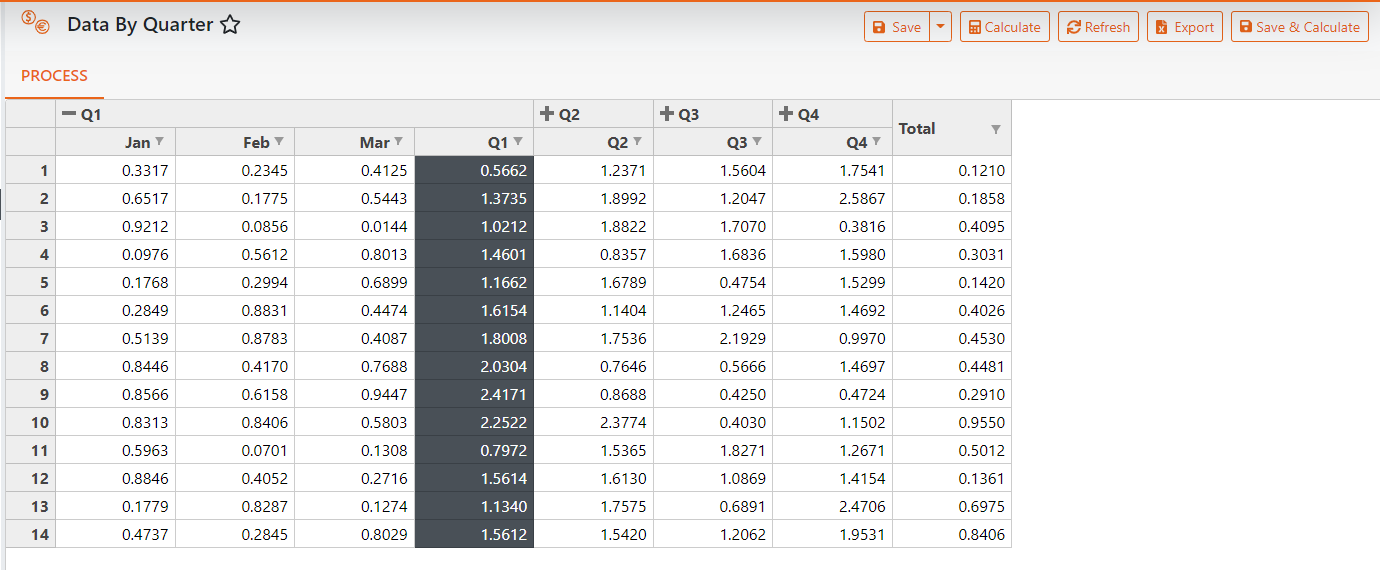
NOTE: the column group does NOT perform any math functions. Keep in mind that if you want the group to collapse to a total column, then a total column will be required, and the math to populate it must be programmed.
ToolKitAndWebTemplate, Model Download 1.0007
Topic Status: Under Construction as of 12/3/2021, 4:10 PM